Digital Economy Analytics Platform from SNG enables SNG clients to compare how businesses, organizations, and households are connected, using, and benefiting from the internet. This unique dashboard and benchmarking tool enables localities and economic development agencies to uncover actionable information and insights. With this new solution from SNG, elected officials can identify broadband gaps and prioritize how to bridge those gaps across their territory.
 Digital Economy Analytics Platform puts all the data from SNG’s in-depth analysis reports at your fingertips in a secure Web-based tool, allowing you to run your own queries and reports. Identify where, how, and by who broadband is being used to uncover gaps and opportunities to be addressed. Broadband utilization and its measurable impacts can quickly be assessed along multiple dimensions of geography, user characteristics, and Internet technologies to identify where broadband is being used to greater or lesser effect.
The easier it is for our clients and their stakeholder groups to gain intelligence from their data, the more value that data has for them. This is why SNG has invested in the Digital Economy Analytics Platform and will continue to develop its capabilities. Our goal is to maximize the social benefits and economic growth that can be derived from broadband technologies and our mission is to arm our clients and stakeholders with the information and intelligence to take effective action towards this goal. The Digital Economy Analytics Platform is one more powerful step toward fulfilling this mission.
 By using the Digital Economy Analytics Platform, users are now just a click of the mouse away from unlocking the keys to maximizing the business and social benefits of broadband:
- Broadband’s Impacts on specific industries – who is using broadband most effectively and who is missing out on opportunities
- Specific e-solutions utilization among industries, regions, etc. and their economic impact.
- The differences between rural and urban areas within a region, or between regions – and how e-Solutions help each overcome challenges.
- The next level of mapping – a map of not only availability – but demand.
- The factors (other than availability) that drive utilization – and how to “bottle that” and bring it to areas where utilization is below average.
- The revenue driven and the cost savings resulting from broadband.
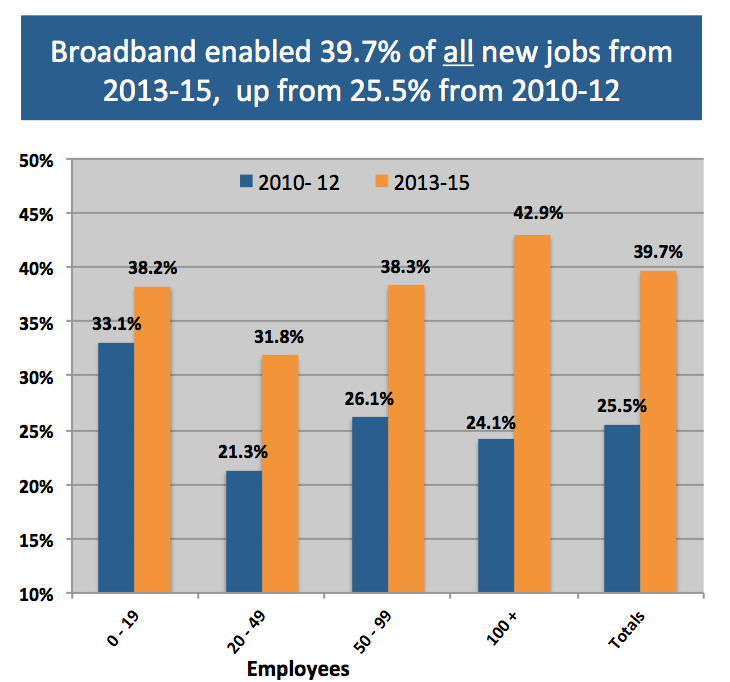
- How broadband impacts job creation.
- Barriers to using broadband and the needs to overcome them.
- How different sizes of organizations best utilize e-solutions.
 “SNG’s latest business intelligence solution, its ‘Digital Economy Analytics Platform’ provides North Carolina the ability to see our broadband data and its economic impact in ways that were previously not easily available to us,” explains Jane Smith Patterson, Executive Director of e-NC “North Carolina now has access to Strategic Network Group’s world-class solution set to analyze broadband utilization and its impacts. The ability for our staff to customize how we see the data and compare it among regions and industries will prove critical for program planning and provide e-NC a strategic advantage to support NC communities regional economic development efforts both locally and globally.”
“What’s really exciting about Digital Economy Analytics Platform is the ability to compare regions not just within your own territory but across the globe,” explains SNG president and CEO Michael Curri. “With results from studies across the globe, those who wish to share their study results can compare their region to other states, provinces, countries, etc. to better understand steps they can take can do to fully leverage the benefits of high speed Internet. Researchers recognize what we have built as a ‘normative database’ – for the laymen, it is simply the only way for one region to compare itself to another in the world of broadband utilization.”
 SNG goes to the heart of a region’s broadband challenges and success by going straight to a region’s businesses, organizations, and households to collect information on how they use and benefit from the Internet. How are people and organizations using broadband? What are they not doing? What are their needs and barriers? How do they benefit and how do these benefits translate into tangible social and economic impacts? How does broadband utilization and its impacts change over time?
All of this collected information, analyzed by SNG’s Broadband Economists and made available through the Digital Economy Analytics Platform enables stakeholders to develop programs and initiatives to drive innovation and economic development.
With our proven track record of showing regions how the use of Internet technologies will be most effective and deliver the most benefits, SNG’s Digital Economy Analytics Platform brings the ability to uncover the drivers of success and the needs of specific geographies more than ever before.Digital Economy Intelligence Database from SNG enables SNG clients to compare regions and industries to uncover actionable information and insights. With this new solution from SNG, regional leaders can leverage the best practices from each region and industry across their territory.
Digital Economy Intelligence Database puts all the data from SNG’s in-depth analysis reports at your fingertips in a secure Web-based tool, allowing you to run your own queries and reports. Identify where, how, and by who broadband is being used to uncover gaps and opportunities to be addressed. Broadband utilization and its measurable impacts can quickly be assessed along multiple dimensions of geography, user characteristics, and Internet technologies to identify where broadband is being used to greater or lesser effect.
The easier it is for our clients and their stakeholder groups to gain intelligence from their data, the more value that data has for them. This is why SNG has invested in the Digital Economy Intelligence Database and will continue to develop its capabilities. Our goal is to maximize the social benefits and economic growth that can be derived from broadband technologies and our mission is to arm our clients and stakeholders with the information and intelligence to take effective action towards this goal. The Digital Economy Intelligence Database is one more powerful step toward fulfilling this mission.
By using the Digital Economy Intelligence Database, users are now just a click of the mouse away from unlocking the keys to maximizing the business and social benefits of broadband:
- Broadband’s Impacts on specific industries – who is using broadband most effectively and who is missing out on opportunities
- Specific e-solutions utilization among industries, regions, etc. and their economic impact.
- The differences between rural and urban areas within a region, or between regions – and how e-Solutions help each overcome challenges.
- The next level of mapping – a map of not only availability – but demand.
- The factors (other than availability) that drive utilization – and how to “bottle that” and bring it to areas where utilization is below average.
- The revenue driven and the cost savings resulting from broadband.
- How broadband impacts job creation.
- Barriers to using broadband and the needs to overcome them.
- How different sizes of organizations best utilize e-solutions.
“SNG’s latest business intelligence solution, its ‘Digital Economy Intelligence Database’ provides North Carolina the ability to see our broadband data and its economic impact in ways that were previously not easily available to us,” explains Jane Smith Patterson, Executive Director of e-NC “North Carolina now has access to Strategic Network Group’s world-class solution set to analyze broadband utilization and its impacts. The ability for our staff to customize how we see the data and compare it among regions and industries will prove critical for program planning and provide e-NC a strategic advantage to support NC communities regional economic development efforts both locally and globally.”
“What’s really exciting about Digital Economy Intelligence Database is the ability to compare regions not just within your own territory but across the globe,” explains SNG president and CEO Michael Curri. “With results from studies across the globe, those who wish to share their study results can compare their region to other states, provinces, countries, etc. to better understand steps they can take can do to fully leverage the benefits of high speed Internet. Researchers recognize what we have built as a ‘normative database’ – for the laymen, it is simply the only way for one region to compare itself to another in the world of broadband utilization.”
SNG goes to the heart of a region’s broadband challenges and success by going straight to a region’s businesses, organizations, and households to collect information on how they use and benefit from the Internet. How are people and organizations using broadband? What are they not doing? What are their needs and barriers? How do they benefit and how do these benefits translate into tangible social and economic impacts? How does broadband utilization and its impacts change over time?
All of this collected information, analyzed by SNG’s Broadband Economists and made available through the Digital Economy Intelligence Database enables stakeholders to develop programs and initiatives to drive innovation and economic development.
With our proven track record of showing regions how the use of Internet technologies will be most effective and deliver the most benefits, SNG’s Digital Economy Intelligence Database brings the ability to uncover the drivers of success and the needs of specific geographies more than ever before.
By Thibaud Châtel
Last year the SNG team partnered with the Norwegian University of Science and Technology of Trondheim, a well-known European “Think Tank” for students. SNG provided support to a Master’s Degree student in Telematics, Steffen André Stople, in the form of an e-Solutions Benchmarking project. We studied the hospitality sector (hotels, bed & breakfast, camping facilities, etc.) of the Hardanger Fjord area, which include the second and third most populated cities of Norway – both extremely tourism dependent.
 With an excellent response rate among the accommodation business of the area, comparisons were able to be drawn between Norway and the American tourism & hospitality sector by using SNG’s previously collected data.
As with much of Europe, Norway is ahead of the US in terms of broadband availability. And given connectivity, utilization should follow the same pattern (even though e-solutions drive utilization as much as availability, see below, next story).
- 3 in 4 (75%) of Norwegian businesses are currently using web-enabled mobile phones to provide worker mobility, in contrast to 2 in 5 Americans.
- 100% of Norwegians businesses are using laptop computers versus 80% of Americans – making mobile e-solutions more adaptable for Norwegians.
- Wireless connection is used by twice the users in Norway than the US (29% versus 14%).
- Nearly 3 in 5 (58%) of Norwegian businesses are using Internet multimedia content or interactive tools while only 3 in 10 (31%) in the US. What’s worse is 35% of US businesses say video virtual tour, dynamic slide shows, live webcams and others are not applicable to their business.
- More than a third (35%) of Americans’ think that tele-working isn’t applicable in this sector as opposed to 0% of Norwegian businesses agreeing with this point of view.
 While these results were well received in Norway, illustrating Scandinavians’ advance in the web-enabled 21st century – it is discouraging for those who believe in broadband’s powers and call the United States “home.” A significant portion of American organizations are not even considering the benefits of broadband and web-enabled solutions!
The “Trondheim paper” illustrates the way to follow, and most satisfied with this work, SNG will continue to support similar projects. Click here to download the full report.

SNG Announces Industry’s First and Only Hands-On, Comparative Database
Digital Economy Analytics Platform from SNG enables SNG clients to compare regions and industries to uncover actionable information and insights. With this new solution from SNG, regional leaders can leverage the best practices from each region and industry across their territory.
Digital Economy Analytics Platform puts all the data from SNG’s in-depth analysis reports at your fingertips in a secure Web-based tool, allowing you to run your own queries and reports. Identify where, how, and by who broadband is being used to uncover gaps and opportunities to be addressed. Broadband utilization and its measurable impacts can quickly be assessed along multiple dimensions of geography, user characteristics, and Internet technologies to identify where broadband is being used to greater or lesser effect.
The easier it is for our clients and their stakeholder groups to gain intelligence from their data, the more value that data has for them. This is why SNG has invested in the Digital Economy Analytics Platform and will continue to develop its capabilities. Our goal is to maximize the social benefits and economic growth that can be derived from broadband technologies and our mission is to arm our clients and stakeholders with the information and intelligence to take effective action towards this goal. The Digital Economy Analytics Platform is one more powerful step toward fulfilling this mission.
By using the Digital Economy Analytics Platform, users are now just a click of the mouse away from unlocking the keys to maximizing the business and social benefits of broadband:
- Broadband’s Impacts on specific industries – who is using broadband most effectively and who is missing out on opportunities
- Specific e-solutions utilization among industries, regions, etc. and their economic impact.
- The differences between rural and urban areas within a region, or between regions – and how e-Solutions help each overcome challenges.
- The next level of mapping – a map of not only availability – but demand.
- The factors (other than availability) that drive utilization – and how to “bottle that” and bring it to areas where utilization is below average.
- The revenue driven and the cost savings resulting from broadband.
- How broadband impacts job creation.
- Barriers to using broadband and the needs to overcome them.
- How different sizes of organizations best utilize e-solutions.
“SNG’s latest business intelligence solution, its ‘Digital Economy Analytics Platform’ provides North Carolina the ability to see our broadband data and its economic impact in ways that were previously not easily available to us,” explains Jane Smith Patterson, Executive Director of e-NC “North Carolina now has access to Strategic Network Group’s world-class solution set to analyze broadband utilization and its impacts. The ability for our staff to customize how we see the data and compare it among regions and industries will prove critical for program planning and provide e-NC a strategic advantage to support NC communities regional economic development efforts both locally and globally.”
“What’s really exciting about Digital Economy Analytics Platform is the ability to compare regions not just within your own territory but across the globe,” explains SNG president and CEO Michael Curri. “With results from studies across the globe, those who wish to share their study results can compare their region to other states, provinces, countries, etc. to better understand steps they can take can do to fully leverage the benefits of high speed Internet. Researchers recognize what we have built as a ‘normative database’ – for the laymen, it is simply the only way for one region to compare itself to another in the world of broadband utilization.”
SNG goes to the heart of a region’s broadband challenges and success by going straight to a region’s businesses, organizations, and households to collect information on how they use and benefit from the Internet. How are people and organizations using broadband? What are they not doing? What are their needs and barriers? How do they benefit and how do these benefits translate into tangible social and economic impacts? How does broadband utilization and its impacts change over time?
All of this collected information, analyzed by SNG’s Broadband Economists and made available through the Digital Economy Analytics Platform enables stakeholders to develop programs and initiatives to drive innovation and economic development.
With our proven track record of showing regions how the use of Internet technologies will be most effective and deliver the most benefits, SNG’s Digital Economy Analytics Platform brings the ability to uncover the drivers of success and the needs of specific geographies more than ever before.
Local case study on broadband utilization shows US business behind Norway: “The Trondheim Paper”
By Thibaud Châtel
Last year the SNG team partnered with the Norwegian University of Science and Technology of Trondheim, a well-known European “Think Tank” for students. SNG provided support to a Master’s Degree student in Telematics, Steffen André Stople, in the form of an e-Solutions Benchmarking project. We studied the hospitality sector (hotels, bed & breakfast, camping facilities, etc.) of the Hardanger Fjord area, which include the second and third most populated cities of Norway – both extremely tourism dependent.
With an excellent response rate among the accommodation business of the area, comparisons were able to be drawn between Norway and the American tourism & hospitality sector by using SNG’s previously collected data.
As with much of Europe, Norway is ahead of the US in terms of broadband availability. And given connectivity, utilization should follow the same pattern (even though e-solutions drive utilization as much as availability, see below, next story).
- 3 in 4 (75%) of Norwegian businesses are currently using web-enabled mobile phones to provide worker mobility, in contrast to 2 in 5 Americans.
- 100% of Norwegians businesses are using laptop computers versus 80% of Americans – making mobile e-solutions more adaptable for Norwegians.
- Wireless connection is used by twice the users in Norway than the US (29% versus 14%).
- Nearly 3 in 5 (58%) of Norwegian businesses are using Internet multimedia content or interactive tools while only 3 in 10 (31%) in the US. What’s worse is 35% of US businesses say video virtual tour, dynamic slide shows, live webcams and others are not applicable to their business.
- More than a third (35%) of Americans’ think that tele-working isn’t applicable in this sector as opposed to 0% of Norwegian businesses agreeing with this point of view.
While these results were well received in Norway, illustrating Scandinavians’ advance in the web-enabled 21st century – it is discouraging for those who believe in broadband’s powers and call the United States “home.” A significant portion of American organizations are not even considering the benefits of broadband and web-enabled solutions!
The “Trondheim paper” illustrates the way to follow, and most satisfied with this work, SNG will continue to support similar projects. Click here to download the full report.
Quick Bytes
News items from the broadband economists…

SNG’s own John DeRidder showed up on the news in Australia, commenting on the NBN initiative. John talks about how the speed may be a great feature, but price point and lack of e-solutions from the NBN are barriers they are going to have to overcome.
Click here to watch the clip on You Tube>>>

Click through to see the latest results from SNG, showing the direct results of how e-solutions increases utilization. Click here to see the chart>>>