June 2011 Bandwidth – The Lighter Side of Utilization and e-Solutions Benchmarking
June 30, 2011 
Tweeting in the Dark… Utilization is (Still) the Key
by Doug Adams
We’ve been talking for months in Bandwidth about Awareness not equaling Adoption… and along with it adoption not begetting Utilization. No matter who might ask you to take a leap of faith, they are not the same, and it is our job to push the boulder up the hill and go from awareness to adoption to usage.
Put another way, just because you have broadband does not mean people will use it… and just because people are using broadband does not mean they are fully realizing the socio-economic benefits:

Typically, and for good reason, we are talking about driving business enablers and e-solutions as the utilization the key to delivering benefits and impacts. And while that remains what we focus on at SNG, let’s take a look at the “lighter side” of the Internet to illustrate just how meaningful utilization can be. And we’re not sure you can get much lighter than social networking.
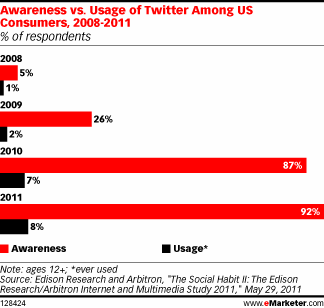
Recent findings show that in the United States, Twitter’s awareness (we’ll use this as a parallel to coverage), adoption, and utilization are very different.
- Awareness: 92% (this even sounds low)
- Adoption: 13% have signed up for account
- Utilization: Only 8% have EVER used it – even a ‘hello’ tweet counts

Looking at what might be considered its big brother, or a brother on steroids, we see that 42% of online Americans last year and a projected 57% this year are actively using Facebook.
I can’t use the classic ‘first to market’ explanation to describe why utilization is higher for one than the other. Otherwise, we’d all be on Friendster or My Space.
For Facebook, adoption is awfully close to usage, with a whopping 70% of users logging on daily. They are closing the gap between adoption and utilization – remember it is our position that adoption is pointless without utilization – by being, in social media circles, compelling.
But what makes something ‘compelling’ or what drives utilization? In Facebook’s case I know that I, for one, feel like if I don’t login that I will miss something. I don’t feel that way with Twitter, and apparently I am not alone.
So back to the world of economic needs and improving quality of life – we’re investing in broadband and e-solutions to drive economic efficiencies and create growth opportunities. These include reaching new markets, developing new business models, creating new relationships with partners and clients.
It is our job to make that feeling of ‘missing out’ a tangible, understandable reason to utilize e-solutions to drive prosperity and growth. Our goal is to ‘personalize’ the return on investment to individual businesses, organizations and households.
SNG’s research, including the DEi scorecard does just that, showing your local businesses what they need to do and the applications they should adapt in order to realize cost efficiencies and increase revenues. This helps make sure that your region does not miss out… on its potential, and on opportunities.
e-Solutions Benchmarking (eSB) in Action
We’re often asked, specifically, “How does an eSB help our region make better decisions and guide investment? Below are a few examples of how an eSB has helped other regions…
Scenario 1: If fiber is going to be available to Professional and Technical Service firms in your region (i.e. county or economic development region) and the Executive’s focus (i.e. governor) is best practices in science and technology-based economic development – what services should e-Incubator staff promote in their awareness and outreach efforts to Professional and Technical Service firms?
Finding: The top e-solutions that Professional and Technical Service firms plan to use and need help with when on DSL are:
- Delivering Services and Content Online
- Social Networking
- Website for Organization
- Online Advertising and Promotion
- Rich Media and Content Creation
The difference in utilization between firms that are on DSL versus Fiber is significant across all seventeen (17) key e-solutions. If Professional and Technical Service firms are to be competitive, they will need to understand where they aren’t competitive and provide support and training to quickly and efficiently bridge those gaps.
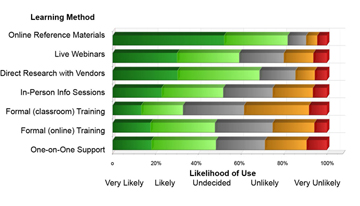
The next question is to identify the most effective means of getting the required information and skill development to these firms.
 Findings: Self-directed online learning is the preferred method of information and skill development for professional and technical service businesses.
The top three preferred methods are online reference materials, direct research with vendors, and live webinars with experts. The two least preferred methods are formal classroom and formal online courses.
Scenario 2: There is pressure to improve the productivity and quality of public services, while reducing costs. Senior planning staff have been directed to identify areas where public investments in broadband can be used to further these goals.
Findings: Two areas exhibit slow adoption of modern and cost effective delivery methods:
Telehealth services – Only 6.7 of health service providers currently provide telehealth services to patients in their home (with 3.2% adoption in progress and 7.1% planning to adopt). This is in spite of the finding that an average of over 70% of households are currently, planning or willing to explore telehealth services. Increased use of telehealth services have the potential to improve access, while reducing costs and demand in such areas as emergency room visits.
Community services, counselling – Only 13.5% of service providers currently provide remote counselling services through such means as live video. Another 3.5% are in the process of adoption and 9.3% are planning to adopt. This level of adoption is well below levels in mental health centers where tele-psychiatry is a proven and leading edge adopter of tele-health services (respective adoption levels are: 26.5% currently use; 5.9% in progress; 14.7 planning).
Quick Bytes
New Look
Have you visited www.sngroup.com lately? If you have, you may have noticed that the home page has undergone a minor facelift, designed to make navigating our site easier than ever.
e-NC and SNG Study Reveals Types of Home-Based Businesses
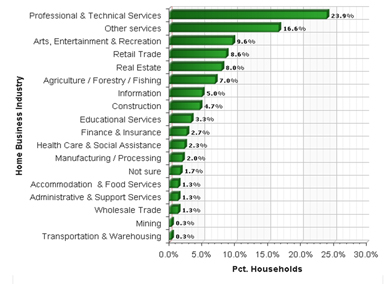
Data collected by SNG in North Carolina in 2010 showed that a third (32%) of households had some type of existing home-based business, with another 12% saying that they would start a home-based business within the next year.
This of course points to the fact that bringing robust Internet to the home, affordably, is not just about enabling leisure activity. In fact, regional economic development depends on broadband to the home.
The top home-based businesses by industry sector (NAICS) are: 
- Professional and Technical Services – 24%
- Arts, Entertainment and Recreation – 10%
- Retail Trade – 9%
- Real Estate – 8%
- Agriculture – 7%
- Information – 5%
- Construction – 5%
Click on chart for a larger version.
So if you’re trying to retain and attract high-paying jobs to your region, ensure that you have a good broadband network and focus on marketing to professionals who can work from home.
Study Reveals Broadband Essential for Economic Development in Europe
According to a study published in May by the McKinsey Global Institute (Internet Matters), Europeans need to be connected if they are to enjoy the significant lifestyle and economic advantages. Not new ground, but what is interesting are some of the findings, directly connecting job creation with broadband, including:
- The Internet generated 21 per cent of GDP growth in the last 5 years in mature countries
- 2.6 jobs are created for every job lost due to the transition to the online economy
- Of the individuals and SMEs who are heavy users of web technology, they are growing and exporting twice as much as others.
Read more about the study by clicking here.
