
How Jefferson County, Oregon Secured $19M for Broadband — With a Plan Built on Local Insight and Hard Data
In rural communities like Jefferson County, Oregon, broadband isn’t just about speed — it’s about access to opportunity. Whether it’s farming operations relying on remote sensors, local students trying to do homework and access remote learning, or small businesses needing to reach customers online, reliable internet is essential infrastructure.
That’s why in 2021, Jefferson County partnered with Strategic Networks Group (SNG) to take a hard look at their broadband challenges — and opportunities. The result? A detailed, data-driven plan that helped the County successfully secure $19 million in broadband funding from the state’s Broadband Deployment Program.
Understanding Local Needs
SNG started by working closely with County officials, local stakeholders, and tribal representatives to understand the full picture. Broadband gaps in Jefferson County weren’t just about geography — they were tied to how people lived, worked, and accessed services across the region.
Through interviews, planning sessions, and our Digital Needs & Readiness Assessment, we helped surface the community’s broadband priorities:
- Stimulating local business growth and expanding local workforce skills
- Remote learning and online education support for students
- Connectivity for agricultural businesses and water management
- Faster emergency response across a large rural service area
This kind of listening and understanding local needs was essential — it laid the groundwork for a plan that reflected the realities on the ground and incorporated direct input from local leaders who emphasized the need for equitable access, resilient infrastructure, and long-overdue investment in rural connectivity.
Filling in the Data Gaps
SNG then got to work collecting the data needed to make the case for investment, including:
- Deploying eCheckup assessments to local businesses and residents to assess current internet utilization, satisfaction levels, and conduct verified internet speed tests
- Mapping unserved and underserved areas, as well as critical infrastructure locations
- Estimating demand and identifying areas where private providers had little incentive to expand
One of the most striking findings? Nearly 80% of residents said they’d switch providers if better service were available — clear evidence of unmet demand.
Turning Insight into Strategy
With strong local input and a solid dataset in hand, SNG worked with County leaders to develop a broadband strategy. This wasn’t a generic plan — it was tailored to Jefferson County’s geography, economic goals, and technical realities.
The strategy included:
- Cost estimates for building middle-mile and last-mile infrastructure
- Partnership models for working with ISPs and utilities
- Governance options for overseeing the network long-term
- Action steps to improve online adoption and utilization programs
The goal was to equip the County with a clear, actionable roadmap to guide decisions, attract investment, and take meaningful steps toward a more connected and resilient broadband future.
A Plan that Delivered Results
Following Jefferson County Commissioners’ official adoption of the Broadband Assessment and Strategic Plan, the County had a clear picture of the approach and infrastructure improvements required to achieve results.
Working with SNG to develop a funding application grounded in local priorities and backed by strong data, the County successfully secured nearly $19 million through Oregon’s Broadband Deployment Program. This funding will support the expansion of fiber broadband to over 1,800 unserved and underserved locations, in partnership with a local private internet service provider.
It’s a big win — and one that didn’t happen by accident. It happened because the County had a clear, data-backed plan and could show how investment would translate into real benefits for residents, businesses, and institutions.
What This Means Going Forward
Now, Jefferson County is moving into the build-out phase. But the work doesn’t stop with construction. The County is continuing to draw on the guidance provided in SNG’s strategic plan as it explores ways to support adoption and ensure the network reaches those who need it most — including through digital navigator programs and ongoing coordination with tribal and regional partners.
For more information about this project, visit SNG’s webpage for Jefferson County
More information about the Broadband Deployment Program Oregon Awards
 SNG Research Brief – Household Broadband
Access to robust and competitive broadband is essential for any community to survive, let alone thrive. Unserved or underserved areas continue to exist in many localities, whether because of limited or no choices for service providers, outdated technology, etc. This research brief provides some insights and data points on the current state of access for households, with focus on rural communities and how they compare to urban areas.
From SNG’s research of over 19,000 households across the North America we are able to reveal some of the important findings that proponents of broadband need to know. These insights are from household data collected directly by SNG rather than statistics provided by service providers or other agencies.
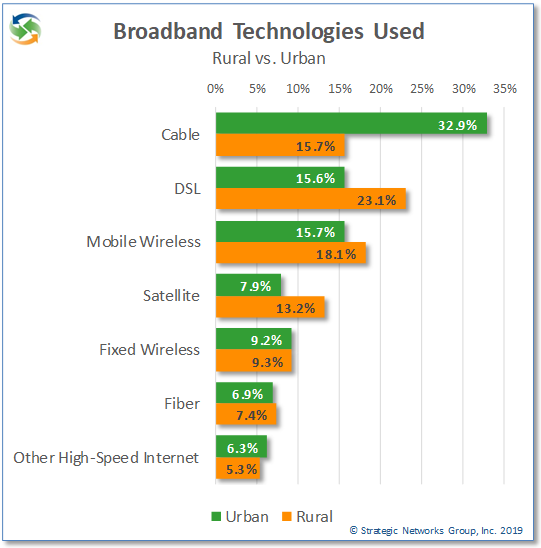
Technologies used
While fiber deployment and use are increasing, cable remains the dominant broadband technology overall with 23.6% of households, followed by DSL at 19.6%. However, the picture changes when you compare urban and rural areas.
While cable dominates urban markets, DSL is still the most used technology in rural areas – which suggests that this is due to the lack of other available options. Fiber use is low for both urban and rural households. For rural areas in particular, the lack of cable and fiber options drives up the use of mobile wireless and satellite as an alternative.
Broadband Service Priorities and Satisfaction
From a user perspective, technology is only relevant for its impact on connection speed, reliability, and price. Understandably, much emphasis is put on speed of connection, since this is how services are sold. However, when it comes to how households prioritize their selection of service, reliability is cited as highest priority with 88% of households compared to 77% who say speed is a high priority and 66% who say affordability is a high priority. These priorities are almost identical between rural and urban households.
So, if that is what households expect, then what is available and how do they feel about the connections they have?
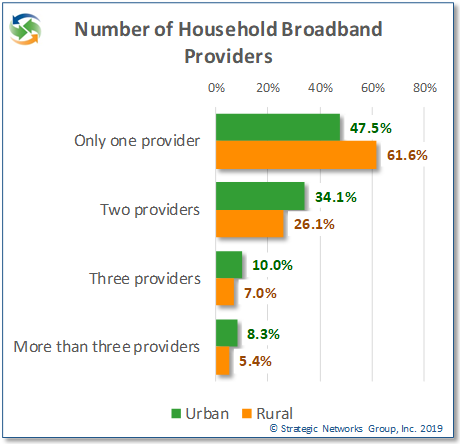
More than half (54%) of households have only one broadband provider available, clearly indicating a lack of choice for most households. For rural areas nearly 62% of households have only one broadband provider to choose from, with implications for competitive service price and quality.
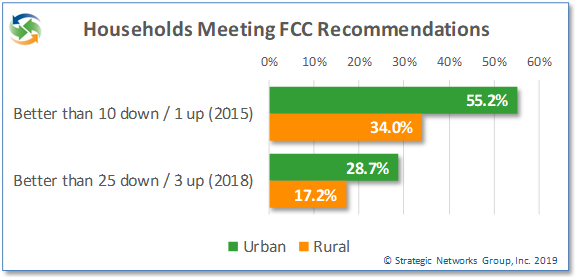
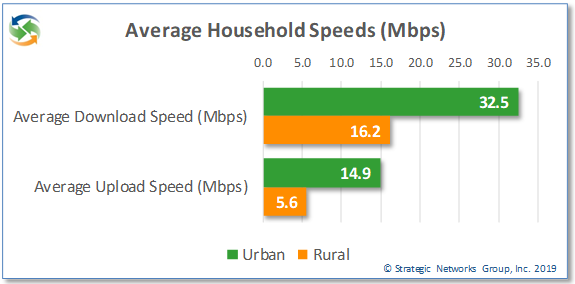
This is reflected in rural service speeds, price, and satisfaction. On average, rural households get approximately half the download speed as urban households and just over one third the upload speed. When it comes to meeting current FCC speed recommendations, 28.7% of urban households meet or exceed the recommended 25 Mbps download and 3 Mbps upload speed, while only 17.2% of rural households do so. Even looking at the old FCC recommendation of 10 Mbps down and 1 Mbps up, just over one third of rural households meet those speeds.
More than 61% of rural households get less than 10 Mbps download speed for an average cost of $70 per month. Overall, rural households pay a monthly cost of $4.38 per MB compared to $2.32 per MB for urban households, almost double the cost. Rural households have less choice and slower speeds and spend more for the same or poorer service.
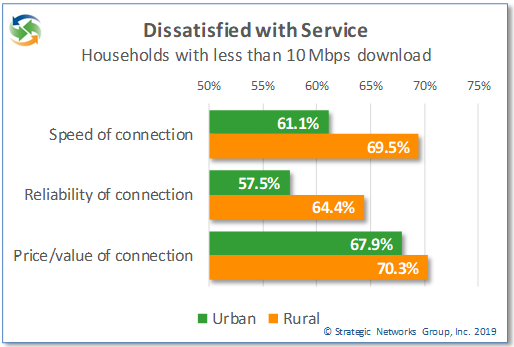
As a result, 70% of rural households subscribing to less than 10 Mbps download speeds are dissatisfied with the value of their service for the price they pay, and 69% are dissatisfied with the speed of service. In addition, 64% of households are dissatisfied with the reliability of their service. The satisfaction levels are only slightly better for urban households with less than 10 Mbps download, with 68% dissatisfied with value, 58% with speed, and 68% with reliability.
This is partly explained by the different mix of technologies deployed in rural areas. With a higher proportion of DSL and satellite connections used in rural areas the quality of speed and reliability is reflected in overall satisfaction levels, resulting in lower satisfaction with value for the price of the service. Fiber connections generate the highest satisfaction levels by far, followed by cable service. Very few households are fully satisfied with DSL or satellite services, and yet for some these are their only options for broadband connectivity.
34.7% of households say that their fiber connection is “worth every penny” for value satisfaction, compared to 7.6% for cable, 4.6% for DSL, and 2.0% for satellite. Another 48% say the value of fiber is “acceptable for what I pay”, versus 38% for cable, 27% for DSL, and 15% for satellite. Similar satisfaction levels by technology are shown for connection speed and reliability. More than any other technology, fiber is clearly a solution that meets household priorities and expectations.
The Implications for Households and Communities
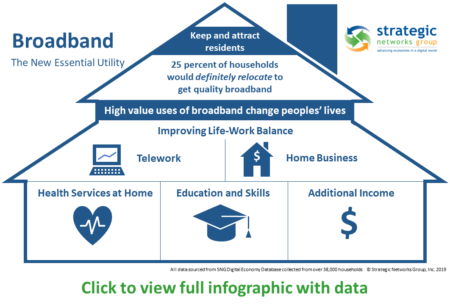
Households without good broadband available to them may choose not to take any of the options forgoing the speed and reliability they need. Households in this situation will not use the internet to its fullest capacity, missing opportunities for them to fully benefit from what the internet can offer – such as new income opportunities, remote access to health care and education. This negatively impacts community well-being as inadequate broadband risks losing population and difficulty in attracting new residents and businesses. This is particularly challenging for smaller, rural communities where SNG research has shown that they are more likely to lack quality broadband and have the most to lose in terms of population decline, especially among youth.
See how a rural county got the support and funding to build the digital infrastructure they need to thrive – Custer County Broadband Impact and Market Assessment.

Find out more about SNG Solutions for Local Economic Development.

With all of the hub-bub around broadband build out, it is important not to forget about utilization… and how you drive meaningful utilization in your community.
A great compliment to our recently announced Market Demand Snapshot is an Action Plan for Broadband Utilization. Designed to spur economic development and job creation, and incorporating feedback from stakeholder workshops, SNG can provide you with will provide the tactics, methods and tools needed to drive broadband adoption and meaningful use.
As we continuously preach, broadband availability alone is not enough to realize its social and economic benefits. An understanding of how to effectively use of broadband for commerce, citizen services and the positioning of rural counties as attractive areas for 21st century business and living will play a critical factor in their long-term success of your broadband investment and your ability to impact the lives of the citizens and businesses already located in the regions.
 SNG can help your region with effective strategic planning for impactful economic development with a sound, three-step approach:
- Identifying and rallying the key stakeholders that need to be actively engaged in the economic development through broadband adoption process via the application of broadband best practices;
- Laying the foundations for an actionable strategic plan that will enhance broadband adoption, meaningful use and job creation across identified verticals of interest, e.g. residences, schools, businesses, libraries, healthcare facilities, public safety and government;
- Driving efficiencies into the community through the adoption of digital purposes and broadband enabled applications that increase quality of life, the growth of economic and employment opportunities, and spurring commercial investment locally.
If you are interested in learning more about how this structured approach can drive demand, adoption and meaningful use to advance your region’s ability to compete globally, attract investment, realize efficiencies, and create jobs, contact Michael Curri.
In June, we announced SNG’s popular new offering: the Digital Economy index scorecards. A composite score of how businesses and organizations use seventeen (17) online practices, or “e-solutions,” the Digital Economy index (DEi) is a unique assessment tool that can be used at any industry, sectoral, or geographic analysis of businesses and organizations to drive productivity and competitiveness.
 DEI enables businesses and organizations to see where they stand relative to their peers. SNG personalizes the value of online practices to individual businesses and organizations by producing customized scorecards that show where improvements can be made to be more productive and competitive an increasingly online economy.
As SNG’s DEi is a composite score of how organizations use online practices to drive productivity and competitiveness, DEi can also be shown strengths and weaknesses within industry sectors.
As we’ve just completed our latest work in North Carolina, let’s take a look at the DEi results by industry and sectors for North Carolina. The overall median DEi for all organizations surveyed in North Carolina is 6.99, with 50 percent of organizations falling between a DEi of 5.34 and 8.45. These scores compare utilization of e-solutions between industry sectors and we’ll explore what that means below.

Opportunities for increasing DEi scores, with the accompanying economic benefits, can be identified and prioritized for action by businesses and organizations.
For example, in North Carolina, the Construction industry (DEi = 6.17) and Information Services industry (DEi = 8.16) have among the lowest and highest median use of 17 types of Internet applications or processes. The average DEi for North Carolina was 6.99 (high is better).
Some of the differences in the DEi score reflect unique characteristics of the structure of that industry. For example, the Construction industry has very high use of certain applications, such as supply chain management and document transfer, while having low use of tele-working.
One interesting example of using the DEi is a comparison of the Education industry (high DEi of 7.96) and Health and Human Services industry (low DEi of 6.60). Comparing these two industries highlights the extent to which the Education industry has pioneered such Internet uses as direct service delivery and remote counselling, while Health and Human Services lag significantly in these areas.
SNG’s proprietary DEi benchmarking capability is a critical tool for proponents of broadband and economic development because DEi shows where organizations and industries are leveraging broadband – and where they should be adopting online practices that will keep them competitive and relevant in a digital economy.
Adjacent to Washington DC and the home of the FCC, Virginia is about to embark on journey along the Broadband Lifecycle. This is one trip the Bristol area in western Virginia is already very familiar with – as in 2007, SNG partnered with FiberToTheHome Council and BVU OptiNet (Bristol Virginia Utility) for step 6 of the broadband lifecycle – measuring outcomes. And with research of impacts, came an opportunity to uncover where to allocate additional fiber resources.
The Center for Information Technology (CIT) of Virginia is targeting surveys to 30 thousand businesses and over 8 thousand homes. With a statewide effort, this is a groundbreaking study on the benefits of a Fiber to the Home (FTTH) deployment. SNG will examine the economic and civic benefits that can be realized, give a holistic picture of the Community Return on Investment – and hopefully drive broadband development and growth throughout the Commonwealth of Virginia.
The project is a follow-up to a successful 2007 SNG study in which the small town of Bristol (17,000 residents) reported big benefits just 12 months after BVU’s initial fiber investment. SNG’s study found that for local businesses, fiber meant operational and sales efficiencies, cost savings, and employment opportunities. Bristol’s newly installed “platform for innovation” had created:
- Dozens of businesses reporting a total increase of $2.7 million in annual sales
- Two-thirds of businesses reporting cost-savings due to fiber use
- Nearly 300 new jobs, including a 10% increase in employment from organizations reporting an increase in sales as a result of the fiber network
Today, the Economic impact study of e‐solutions in the Bristol area is a core project component, quantifying the impacts of implementing e‐solutions from BVU OptiNet’s deployment. In conjunction with the state-wide initiative, SNG is again collecting data in Bristol that will serve as benchmarks for the rest of Virginia, helping identify the most significant and immediate economic and social benefits from e‐solutions. This will help guide Virginia as it makes decisions for what solutions are needed, and where, throughout the Commonwealth.
Findings from the Bristol test bed will be used to take effective awareness and adoption strategies for education, workforce, economic growth, healthcare and community. Learnings will also help prioritize planning activities, workshops, awareness campaigns, training on e‐solutions that will sustain and grow broadband.
Across the globe the 2008-09 global downturn had deep impacts. Many households were stretched thin, looking for ways to supplement lost income or to supplement declining or stagnant salaries.
SNG worked with the e-North Carolina Authority in 2010 to conduct “eSolutions Benchmarking” across the state to understand how households are using broadband to tackle some of their challenges.
The study revealed the potential of broadband for competitiveness and economic opportunity:
- Nearly a third (31%) of the State’s broadband households operate a business from their home;
- The number of households either currently running (31%) or planning to run a business from their home in the
next twelve months (14%) is nearly half (45%) of the State’s broadband
households; - Even more broadband households are either now using (41%) or planning to use (24%) broadband to sell items online.
That’s nearly two-thirds (65%) of broadband households using it to at least supplement their income; - Most (85%) of home-based businesses said that broadband was essential to their business. More than half
(54%) said that they would not be in business if they did not have broadband while two in five (41%) would have to relocate if broadband was not available in their community.
In good times and in bad, broadband is critical for community members to earn income (and extra
income). But in bad times, research shows us that home-based businesses and sole proprietorships are more likely to sprout up. More than ever, it is critical for states and communities that want to remain competitive – and even thrive – to have broadband as a platform for innovation and competitiveness.