We’re often asked, specifically, “How does an eSB help our region make better decisions and guide investment? Below are a few examples of how an eSB has helped other regions…
Scenario 1: If fiber is going to be available to Professional and Technical Service firms in your region (i.e. county or economic development region) and the Executive’s focus (i.e. governor) is best practices in science and technology-based economic development – what services should e-Incubator staff promote in their awareness and outreach efforts to Professional and Technical Service firms?
Finding: The top e-solutions that Professional and Technical Service firms plan to use and need help with when on DSL are:
- Delivering Services and Content Online
- Social Networking
- Website for Organization
- Online Advertising and Promotion
- Rich Media and Content Creation
The difference in utilization between firms that are on DSL versus Fiber is significant across all seventeen (17) key e-solutions. If Professional and Technical Service firms are to be competitive, they will need to understand where they aren’t competitive and provide support and training to quickly and efficiently bridge those gaps.
The next question is to identify the most effective means of getting the required information and skill development to these firms.
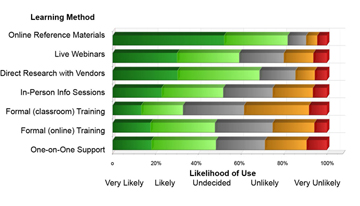
 Findings: Self-directed online learning is the preferred method of information and skill development for professional and technical service businesses.
The top three preferred methods are online reference materials, direct research with vendors, and live webinars with experts. The two least preferred methods are formal classroom and formal online courses.
Scenario 2: There is pressure to improve the productivity and quality of public services, while reducing costs. Senior planning staff have been directed to identify areas where public investments in broadband can be used to further these goals.
Findings: Two areas exhibit slow adoption of modern and cost effective delivery methods:
Telehealth services – Only 6.7 of health service providers currently provide telehealth services to patients in their home (with 3.2% adoption in progress and 7.1% planning to adopt). This is in spite of the finding that an average of over 70% of households are currently, planning or willing to explore telehealth services. Increased use of telehealth services have the potential to improve access, while reducing costs and demand in such areas as emergency room visits.
Community services, counselling – Only 13.5% of service providers currently provide remote counselling services through such means as live video. Another 3.5% are in the process of adoption and 9.3% are planning to adopt. This level of adoption is well below levels in mental health centers where tele-psychiatry is a proven and leading edge adopter of tele-health services (respective adoption levels are: 26.5% currently use; 5.9% in progress; 14.7 planning).
