Household Access to Robust and Competitive Broadband
February 5, 2019 SNG Research Brief – Household Broadband
Access to robust and competitive broadband is essential for any community to survive, let alone thrive. Unserved or underserved areas continue to exist in many localities, whether because of limited or no choices for service providers, outdated technology, etc. This research brief provides some insights and data points on the current state of access for households, with focus on rural communities and how they compare to urban areas.
From SNG’s research of over 19,000 households across the North America we are able to reveal some of the important findings that proponents of broadband need to know. These insights are from household data collected directly by SNG rather than statistics provided by service providers or other agencies.
Technologies used
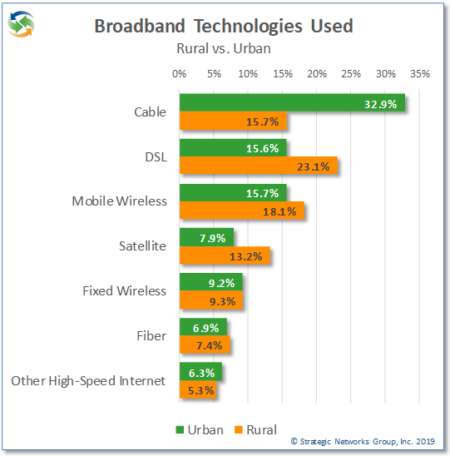
While fiber deployment and use are increasing, cable remains the dominant broadband technology overall with 23.6% of households, followed by DSL at 19.6%. However, the picture changes when you compare urban and rural areas.
While cable dominates urban markets, DSL is still the most used technology in rural areas – which suggests that this is due to the lack of other available options. Fiber use is low for both urban and rural households. For rural areas in particular, the lack of cable and fiber options drives up the use of mobile wireless and satellite as an alternative.
Broadband Service Priorities and Satisfaction
From a user perspective, technology is only relevant for its impact on connection speed, reliability, and price. Understandably, much emphasis is put on speed of connection, since this is how services are sold. However, when it comes to how households prioritize their selection of service, reliability is cited as highest priority with 88% of households compared to 77% who say speed is a high priority and 66% who say affordability is a high priority. These priorities are almost identical between rural and urban households.
So, if that is what households expect, then what is available and how do they feel about the connections they have?
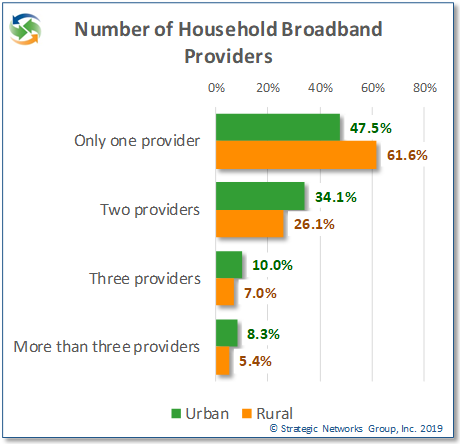
More than half (54%) of households have only one broadband provider available, clearly indicating a lack of choice for most households. For rural areas nearly 62% of households have only one broadband provider to choose from, with implications for competitive service price and quality.
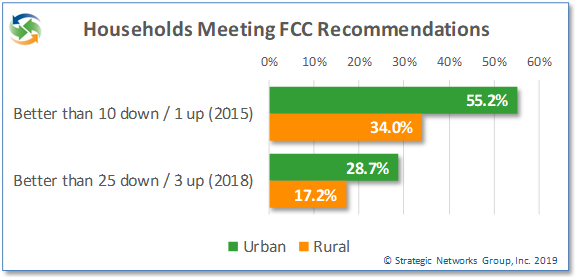
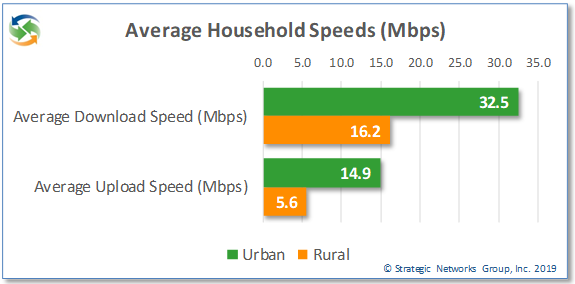
This is reflected in rural service speeds, price, and satisfaction. On average, rural households get approximately half the download speed as urban households and just over one third the upload speed. When it comes to meeting current FCC speed recommendations, 28.7% of urban households meet or exceed the recommended 25 Mbps download and 3 Mbps upload speed, while only 17.2% of rural households do so. Even looking at the old FCC recommendation of 10 Mbps down and 1 Mbps up, just over one third of rural households meet those speeds.
More than 61% of rural households get less than 10 Mbps download speed for an average cost of $70 per month. Overall, rural households pay a monthly cost of $4.38 per MB compared to $2.32 per MB for urban households, almost double the cost. Rural households have less choice and slower speeds and spend more for the same or poorer service.
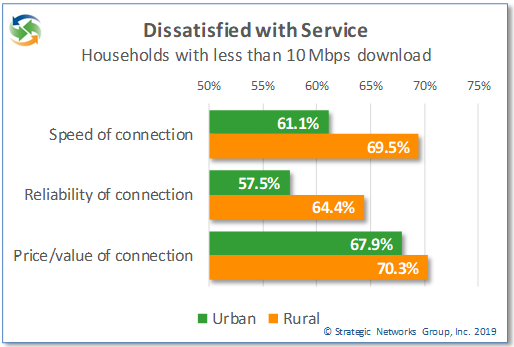
As a result, 70% of rural households subscribing to less than 10 Mbps download speeds are dissatisfied with the value of their service for the price they pay, and 69% are dissatisfied with the speed of service. In addition, 64% of households are dissatisfied with the reliability of their service. The satisfaction levels are only slightly better for urban households with less than 10 Mbps download, with 68% dissatisfied with value, 58% with speed, and 68% with reliability.
This is partly explained by the different mix of technologies deployed in rural areas. With a higher proportion of DSL and satellite connections used in rural areas the quality of speed and reliability is reflected in overall satisfaction levels, resulting in lower satisfaction with value for the price of the service. Fiber connections generate the highest satisfaction levels by far, followed by cable service. Very few households are fully satisfied with DSL or satellite services, and yet for some these are their only options for broadband connectivity.
34.7% of households say that their fiber connection is “worth every penny” for value satisfaction, compared to 7.6% for cable, 4.6% for DSL, and 2.0% for satellite. Another 48% say the value of fiber is “acceptable for what I pay”, versus 38% for cable, 27% for DSL, and 15% for satellite. Similar satisfaction levels by technology are shown for connection speed and reliability. More than any other technology, fiber is clearly a solution that meets household priorities and expectations.
The Implications for Households and Communities
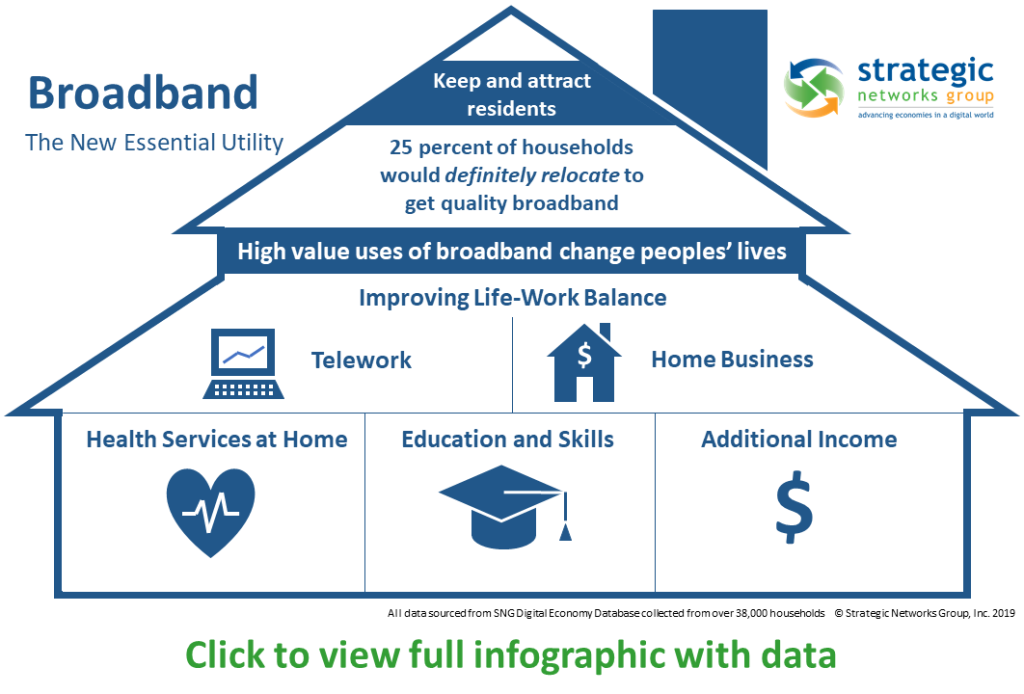
Households without good broadband available to them may choose not to take any of the options forgoing the speed and reliability they need. Households in this situation will not use the internet to its fullest capacity, missing opportunities for them to fully benefit from what the internet can offer – such as new income opportunities, remote access to health care and education. This negatively impacts community well-being as inadequate broadband risks losing population and difficulty in attracting new residents and businesses. This is particularly challenging for smaller, rural communities where SNG research has shown that they are more likely to lack quality broadband and have the most to lose in terms of population decline, especially among youth.
See how a rural county got the support and funding to build the digital infrastructure they need to thrive – Custer County Broadband Impact and Market Assessment.
Find out more about SNG Solutions for Local Economic Development.

